


Bitcoin's latest record move in 10 charts
Trend of the Week
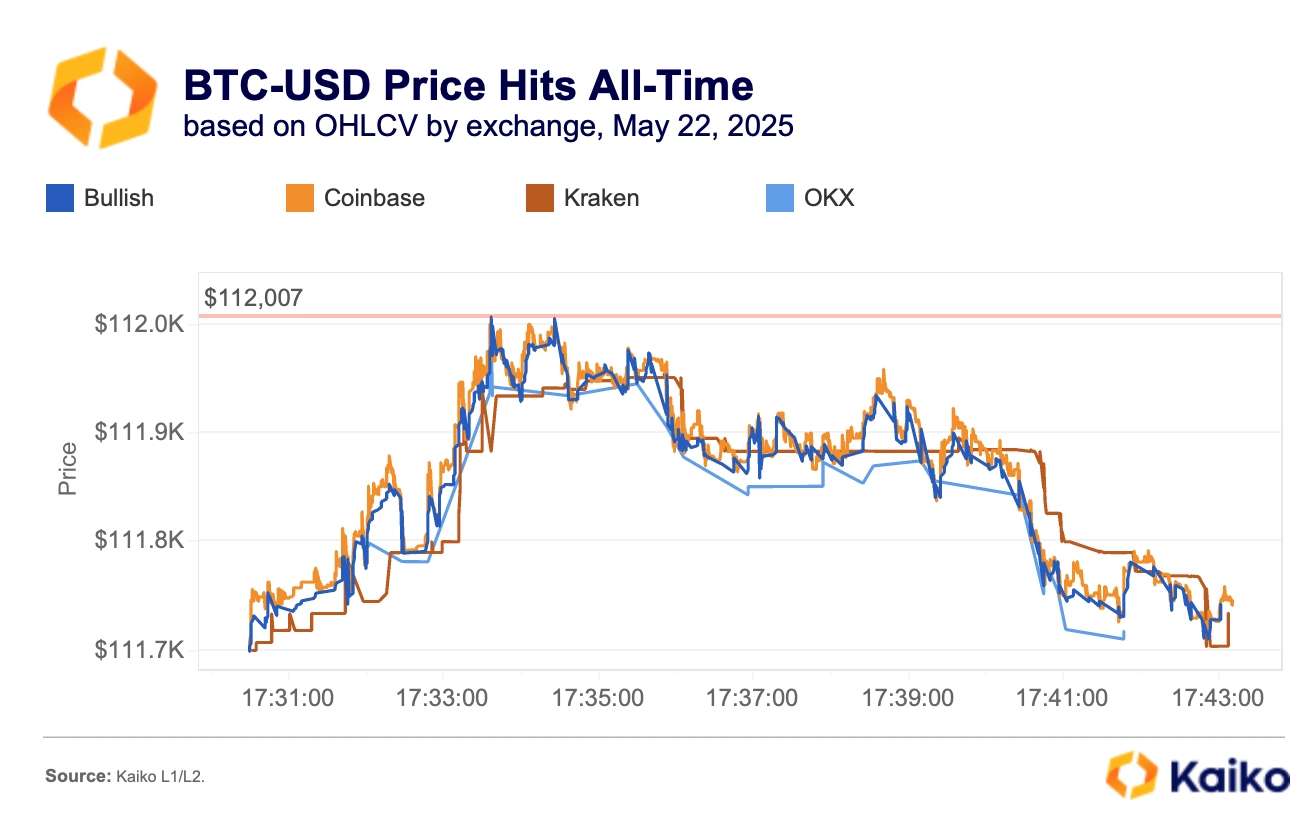
New highs.
Bitcoin reached an all-time high of $112K on May 22, despite a selloff in traditional risk assets driven by concerns over the U.S. fiscal outlook. Peak prices were recorded on platforms like Coinbase and Bullish, while exchanges such as Kraken and OKX did not see trades at that level.
Trade volume was muted.
Spot trading volumes remained subdued throughout the rally, signaling that many market participants are still sidelined amid lingering macroeconomic uncertainty.
Low leverage.
Despite the price surge, market leverage remains relatively low signalling a lack of retail euphoria. Funding rates turned positive in early May, showing renewed bullish sentiment, but they remain far below the overheated levels seen during the post-election rally.
Options signal balance.
Bitcoin’s IV smile for upcoming expirations remains fairly balanced, indicating a neutral medium-term outlook, while strong short-term demand for upside exposure suggests traders expect Bitcoin to hold steady in the coming weeks.
Chart of the Week
Breaking down Bitcoin’s rally in ten charts.
Bitcoin hit a new all-time high of $112K last week, the first since December 2024, before pulling back slightly as traders locked in profits. As of early Monday, prices had settled just below peak levels.
However, Bitcoin’s all-time high varies across markets. Using Kaiko’s tick level data by exchange for BTC-USD, we saw peak prices on platforms like Coinbase and Bullish.
Despite the dramatic price move, spot trading volume remained remarkably subdued. On May 22, volume barely topped $20 billion, more than 50% below the activity seen during Trump’s inauguration or the December 5th 2024 rally, suggesting many participants are still waiting on the sidelines amid macro uncertainty. Leverage and funding rates are also muted which indicates low retail participation.
Content Original Link:
" target="_blank">


 Stays Firm as Trump-Musk Feud Escalates Over 2025 Budget Politics")


 Crashed On Friday")